There are very interesting things happening recently at the interface between data and design. We’re in a data driven world, and as handy as that is for analysis and decision-making, our brains are not designed to extract information easily from equations and spreadsheets. Data visualization is, at its heart, the art of shaping data into graphical representations that appeal to our senses and give our limited cognitive capacity what it likes best. An added benefit is that, properly done, data visualizations can be stunningly beautiful. The combination of data, aesthetics, and interactivity creates a medium that can inform, engage and move viewers.
This week we’re going to take a look at five of the best recent interactive data visualizations from around the web. Some of these will need a recent browser to work properly, as they depend on cutting-edge HTML5 and CSS.
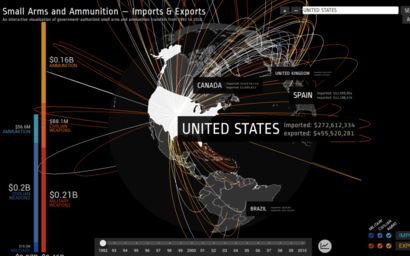
The Global Arms Trade from Google
This hard-hitting visualization from Google tracks international small-arms and ammunition sales. Google wanted to make some contribution to helping reduce the 60% of violent deaths around the world that are caused by small arms, and as a data driven company, they are applying their strengths to publicizing the issue.
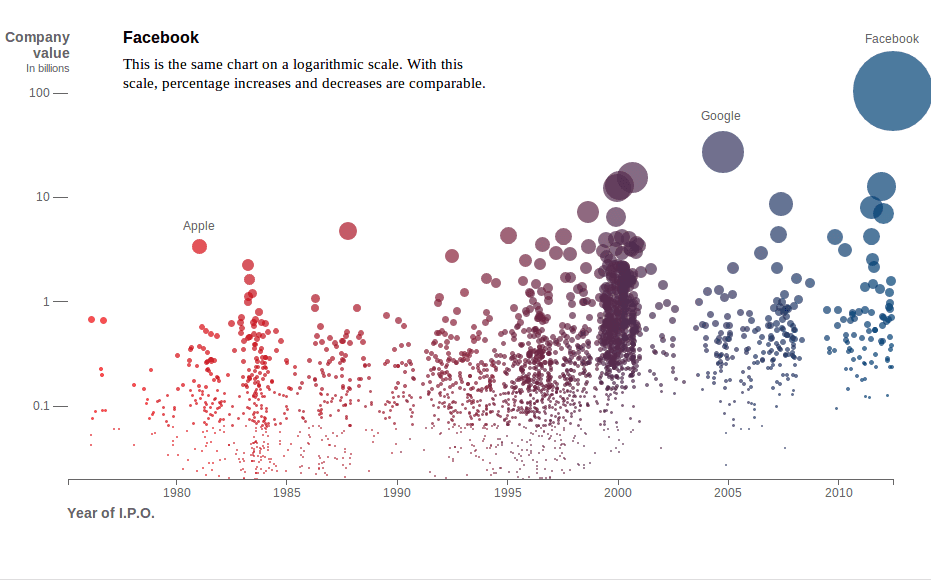
Tech IPOs from the NYT
Facebook’s recent IPO has generated countless meters of print, but this visualization from the New York Times does the best job showing where that event sits in the history of Tech IPOs since 1980.
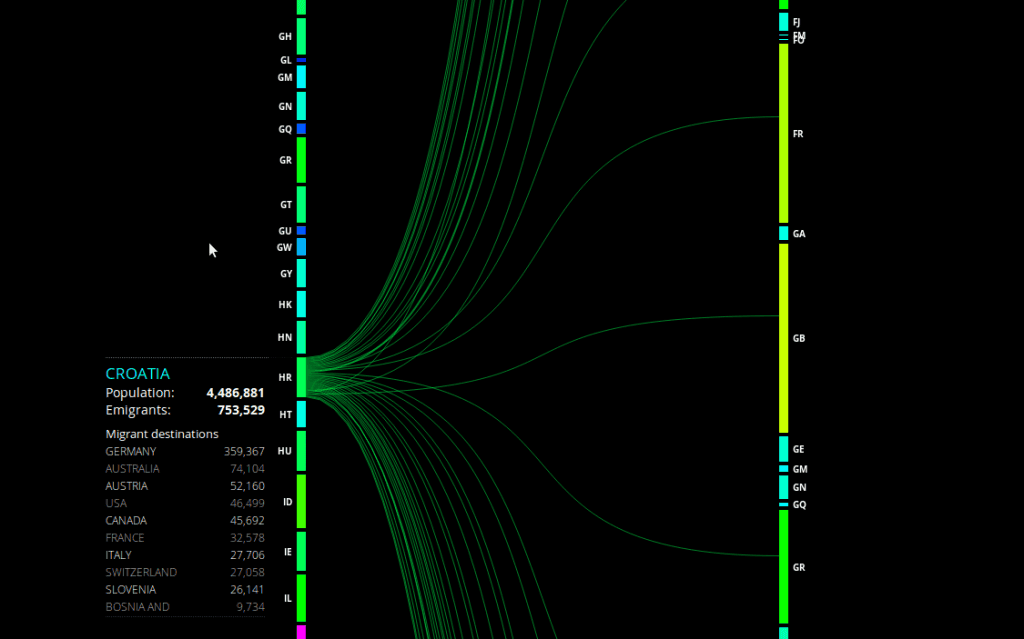
Peoplemovin from Carlo Zapponi
Peoplemovin is a fascinating way to investigate where the world’s 215,738,321 migrants came from and where they are headed.
Journalism’s Voyage West from Stanford University’s Rural West Initiative
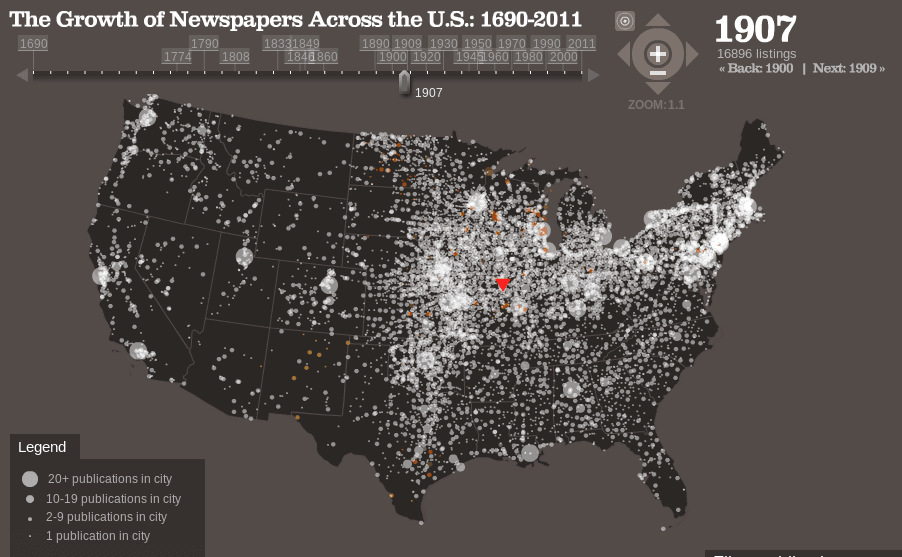 The death of the traditional American newspaper is much touted. In this visualization we see its birth pangs, from its earliest stirrings in the colonies of the East through its spread across the continent, and to the present day.
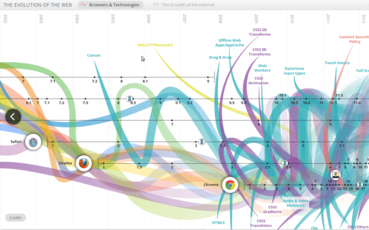
The Evolution of the Web from Google, Hyperakt and Vizzuality
The Biodigital Human
This one isn’t really a data visualization in the same sense as the others, but it’s pretty cool, so we thought we’d include it anyway.
We’re sure you guys have a favorite data visualization. If you’d like to share, feel free to let us know in the comments or on Twitter.

