Call us: 800.288.7387
salesteam@nyi.net
  • Get a Quote
  • Login
NYINYINYINYI
  • Solutions
    • Colocation & Data Centers
    • Network & Interconnection
    • Hybrid Cloud
    • Bare Metal
    • Professional Services
    • Managed Services
  • Resources
    • News
    • Events
    • Blog
  • About NYI
    • The NYI Difference
    • Partner Program
    • Careers
    • Community
    • Compliance
  • Contact
Next Previous

More Stats, More Data and More Insight at Your Fingertips: Helpdesk Upgrade

10 December, 2015

NYI now gives you more stats and data than ever before with our recently upgraded Helpdesk functionality. As an NYI colocation or dedicated server client, you can now view more detailed information regarding your specific bandwidth usage. Kevin Phair, Director of Operations, explains a few of the updates below:   Screen-Shot-2015-12-10-at-10.48.36-AM

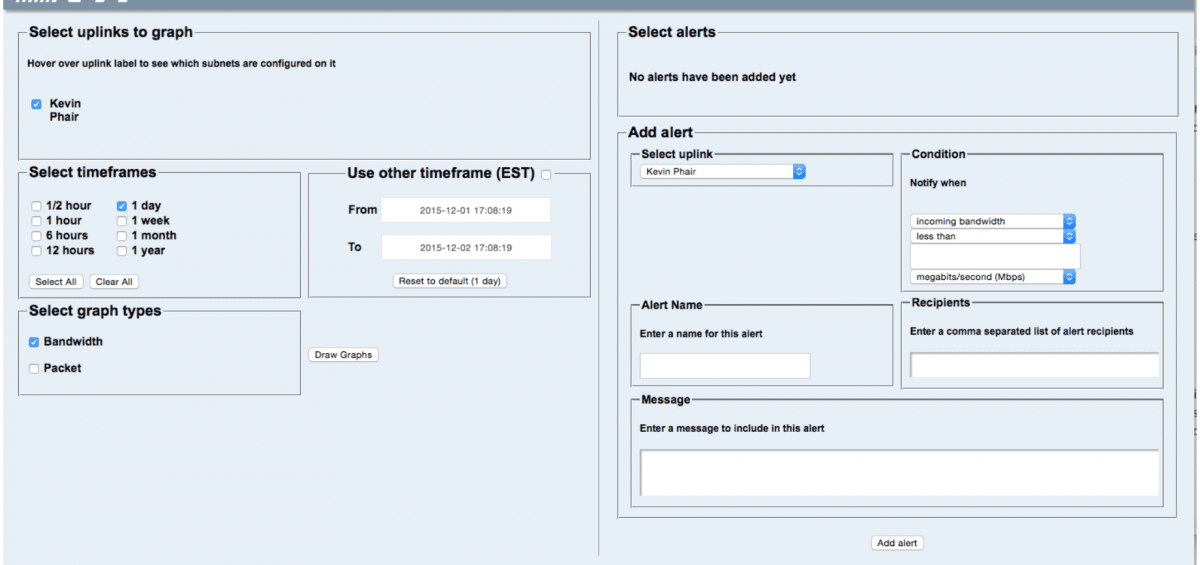
You can see in the graphic above that the left side of the screen is for creating and viewing your traffic graphs. The top field labeled ‘Select uplinks to graph,’ will list each of your uplinks with a description. In this example, you can see that I only have one uplink that uses my name as the description. If you have multiple physical uplinks on a single VLAN, you will see entries for each physical port, as well as the VLAN itself. If this is the case, you will most typically want to view graphs (and setup alerts against) the VLAN itself instead of the individual ports.

You can even customize the default settings so that it matches up to your specific port information.

The second row of boxes (on the left-hand side) allows you to take a closer look at time periods. The left-most field lets you select from several set time periods. On the right-hand side you can select from any arbitrary time period. The bottom row lets you choose to graph bandwidth, packets per second, or both.

The fields on the right side of this page allow you to configure alerts based on your usage. The top box lists any alerts that you have created. Below that, you can select the link to create an alert from the left-hand box, and the value that you wish to monitor from the right-hand side.  You can choose incoming, outgoing, or both for bandwidth or packet rate. The other fields are used to configure the actual threshold.

The next three boxes down allow you to name the alert, set email addresses for alert recipients, and define a message to go along with the alert.


Recently on the NYI Blog

  • Megaport and NYI Mark 10 Years of Partnership with Expansion to Chicago
  • NYI Newsletter: Q1 2025
  • NYI Newsletter: Q4 2024
  • NYI Newsletter: Q3 2024
  • DataBank and NYI Partner to Offer Enhanced Connectivity Ecosystem in NYC

NYI
NYI is a trusted infrastructure partner to small and medium-sized enterprise clients across a range of industries. We drive infrastructure optimization through flexible integrated hybrid IT solutions and strategic partnerships that result in cost and performance efficiencies. Our experts offer insights and end-to-end support so that your teams can be freed to focus on innovation and growth.

Contact Us

  • New York City
    60 Hudson Street
    New York, New York 10013
  • Chicago
    800 Jorie Blvd.
    Oak Brook, IL 60523
  • NYI Headquarters
    T: 212.269.1999     
    T:
    800.288.7387
  • Terms and Conditions
  • Service Level Agreement
  • Privacy Policy
New York Internet
Copyright 2024. All rights reserved worldwide.
  • Solutions
    • Colocation & Data Centers
    • Network & Interconnection
    • Hybrid Cloud
    • Bare Metal
    • Professional Services
    • Managed Services
  • Resources
    • News
    • Events
    • Blog
  • About NYI
    • The NYI Difference
    • Partner Program
    • Careers
    • Community
    • Compliance
  • Contact
NYI